
Veteran Army Gold review: independent test of the 3 presets on MT5
Veteran Army Gold review: the gallery reproduces,
capital sets the risk
Three presets, three drawdown ranges, a gallery of backtests. I reran his tests at another broker, on the version on sale and with default settings. The numbers hold. The real risk for a buyer lies elsewhere: in the starting capital.
No optimisation
Risk warning: this content is strictly educational and is not investment advice. Leveraged trading carries a high risk of capital loss. No trading robot is recommended here.
The test on video, report by report: watch it on YouTube.
Almost 30,000 dollars of profit in three and a half years on the most cautious preset: that is what the gallery of Veteran Army Gold shows, a gold robot sold for 899 dollars on the MQL5 Market. I reran that backtest at IC Markets, a different broker from his.
The gap is 50 dollars: +29,994.14 against +29,943.79, with the same profit factor of 1.70. And yet, on that same cautious preset, a 10,000 dollar account started in April 2026 went through a drawdown twice as deep as at the recommended capital. The robot did not change. The capital did.
This page details the twenty-three backtests of this test, the MT5 reports behind every number, and what to know before you run this robot.
Veteran Army Gold 1.13, the version on sale, default settings. IC Markets, hedging account, 1:100 leverage, XAUUSD H1. His window from 1 January 2023 to 31 July 2026 on 1 minute OHLC, and a real ticks control from April to September 2026. Full test conditions and their limits are detailed below.
What the Veteran Army Gold page says
Veteran Army Gold is an MT5 expert advisor released on 1 August 2026 on the MQL5 Market by Seckin Erkut. At the time of the test it sells for 899 dollars, or 129 dollars a month to rent, and the page shows version 1.13, updated on 3 August. It trades gold only, XAUUSD, on H1 and H4, and requires a hedging account.
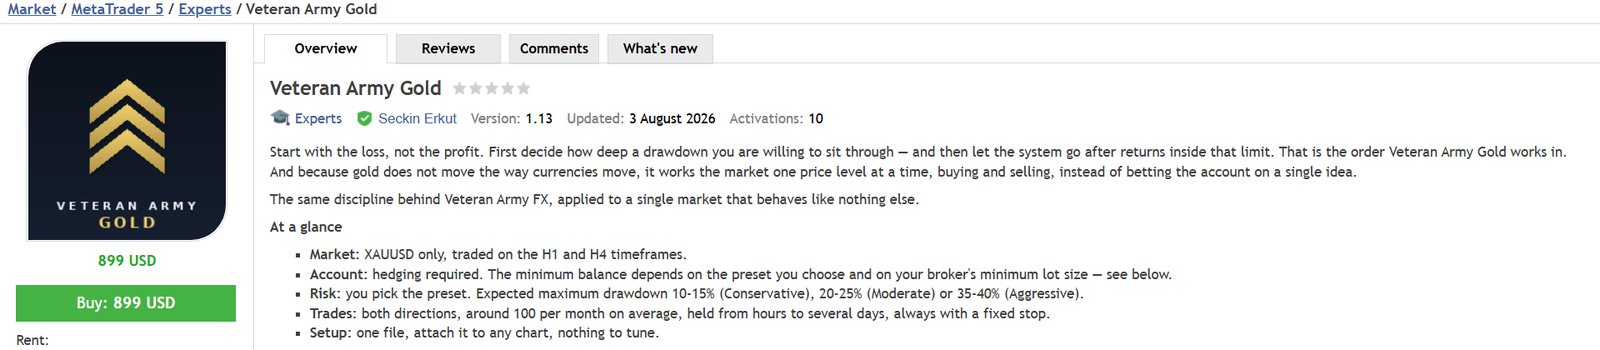
The idea behind it fits in one sentence: you do not pick a return, you first pick the loss you accept. There are three risk presets, Conservative (the default), Moderate and Aggressive, each with a drawdown range from a Monte Carlo simulation and a historical annual return from his backtest. All three presets take the same trades; only the position size changes. He says so himself, and it can be checked.
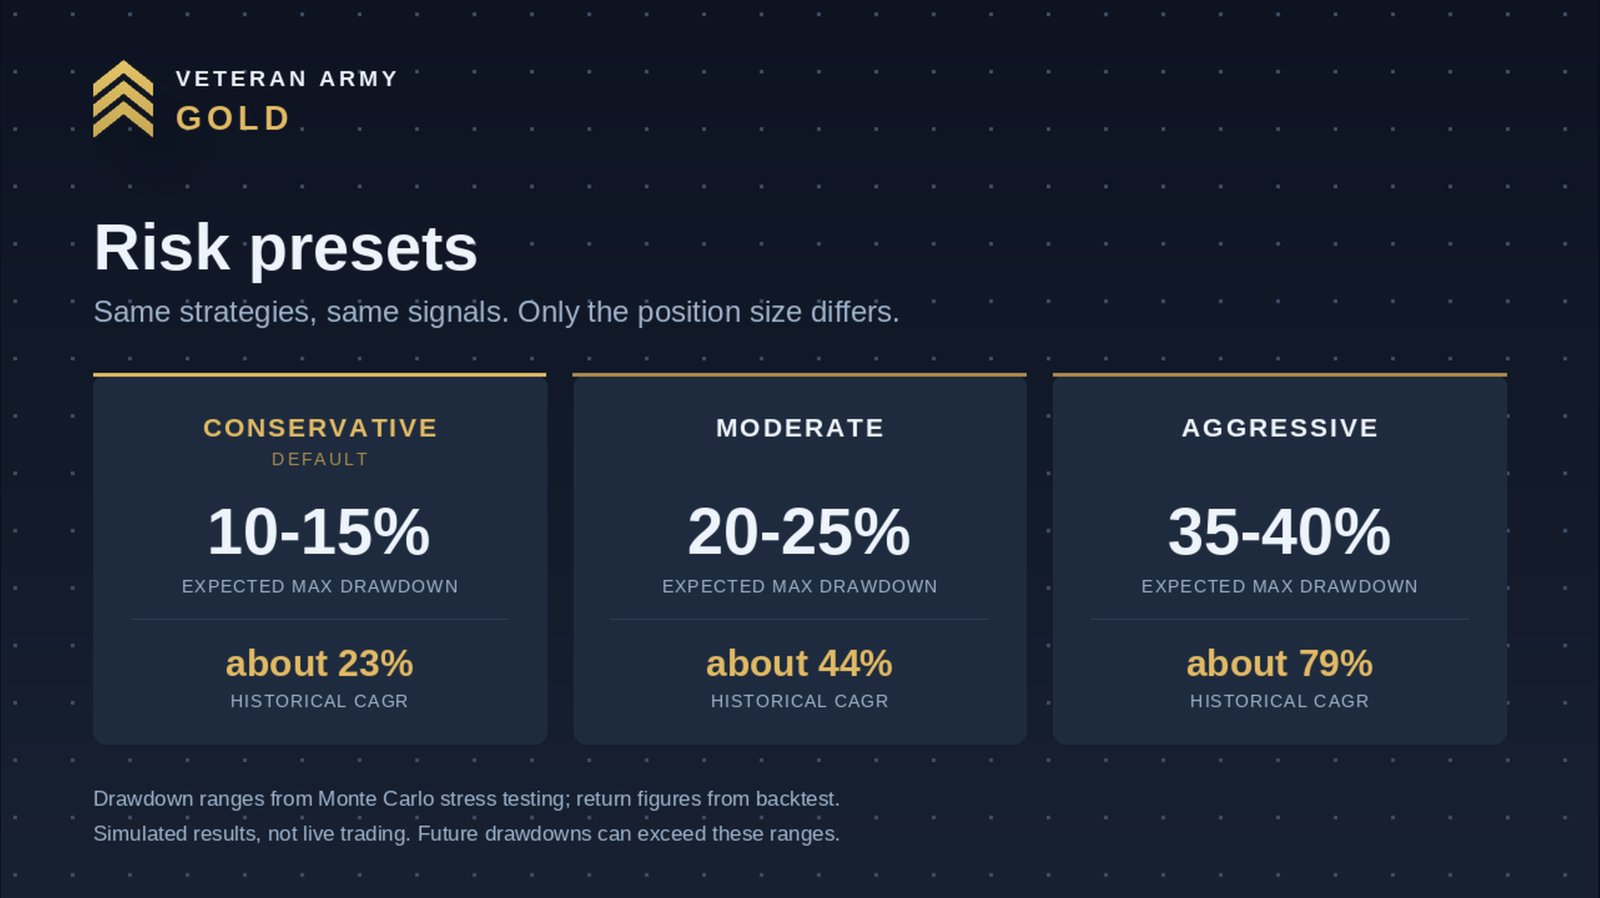
| Preset | Expected drawdown (Monte Carlo) | Stated annual return | Recommended minimum capital |
|---|---|---|---|
| Conservative (default) | 10 to 15% | about 23% | 20,000 $ |
| Moderate | 20 to 25% | about 44% | 15,000 $ |
| Aggressive | 35 to 40% | about 79% | 10,000 $ |
The page makes several precise, therefore testable, claims: no grid, no martingale, no averaging down; a fixed stop on every trade from the moment it opens; about a hundred trades a month; and, over twenty years of testing, never more than 26 open positions at once. At startup, the robot logs what it loads: 66 strategies out of 66, a single symbol, a hedging account. It is a portfolio of strategies on one market, not a single strategy.
One input matters more than the others: ReferenceCapital, set to 20,000. Published lot sizes apply to a 20,000 dollar balance and are scaled to the real balance. Section 8 explains why that is where a buyer's real risk sits.
Test conditions
| Item | Test value |
|---|---|
| Robot and version | Veteran Army Gold 1.13, the version on sale (updated 3 August 2026), free Market demo (strategy tester only) |
| Settings | Defaults, one backtest per preset, no optimisation |
| Broker and server | IC Markets, ICMarketsSC-Demo server, hedging account |
| Leverage and currency | 1:100, US dollars |
| Symbol and timeframe | XAUUSD, H1 |
| Capital | 10,000 $ like his gallery, then 5,000 $, then the minimum capital he recommends for each preset |
| Periods | His window (1 January 2023 to 31 July 2026), April to September 2026, and the weeks after release (1 August to 23 September 2026) |
One detail of method matters. At IC Markets, real gold ticks only go back to April 2026. Over three and a half years, a "real ticks" backtest would be mostly generated by the terminal without saying so. The long window therefore runs in 1 minute OHLC mode, and real ticks serve as a control from April to September 2026, where both modes exist.
That is also the mode of his gallery. His Conservative gallery report shows 5,067,247 ticks for 21,180 bars, about 239 ticks per one hour candle. That is the exact signature of 1 minute OHLC: four prices per one minute candle, sixty minutes per hour, 240. Real ticks give tens of thousands of ticks per bar (31,853 in our June 2026 control). My report shows 5,062,735 ticks for 21,157 bars: the same modelling, within 0.1%. The product page describes "every tick based on real ticks" modelling; the gallery report does not show that. Section 7 measures what the difference changes.
If these modelling modes are new to you, our guide on how to backtest an EA in MetaTrader 5 explains them one by one.
His gallery, reproduced at another broker
First check: the Conservative preset, over his window, with his 10,000 dollar starting balance. Here is his report, as published in the product gallery, then mine.
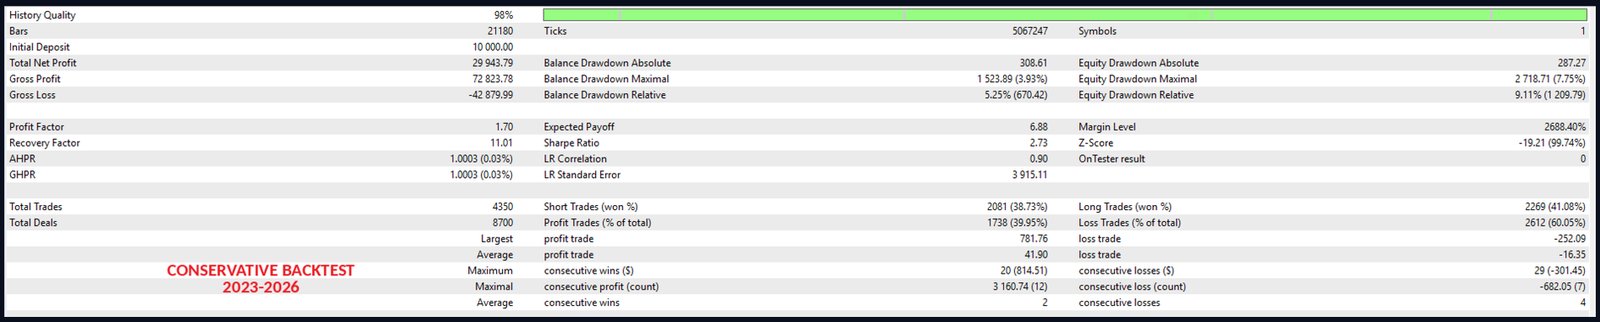
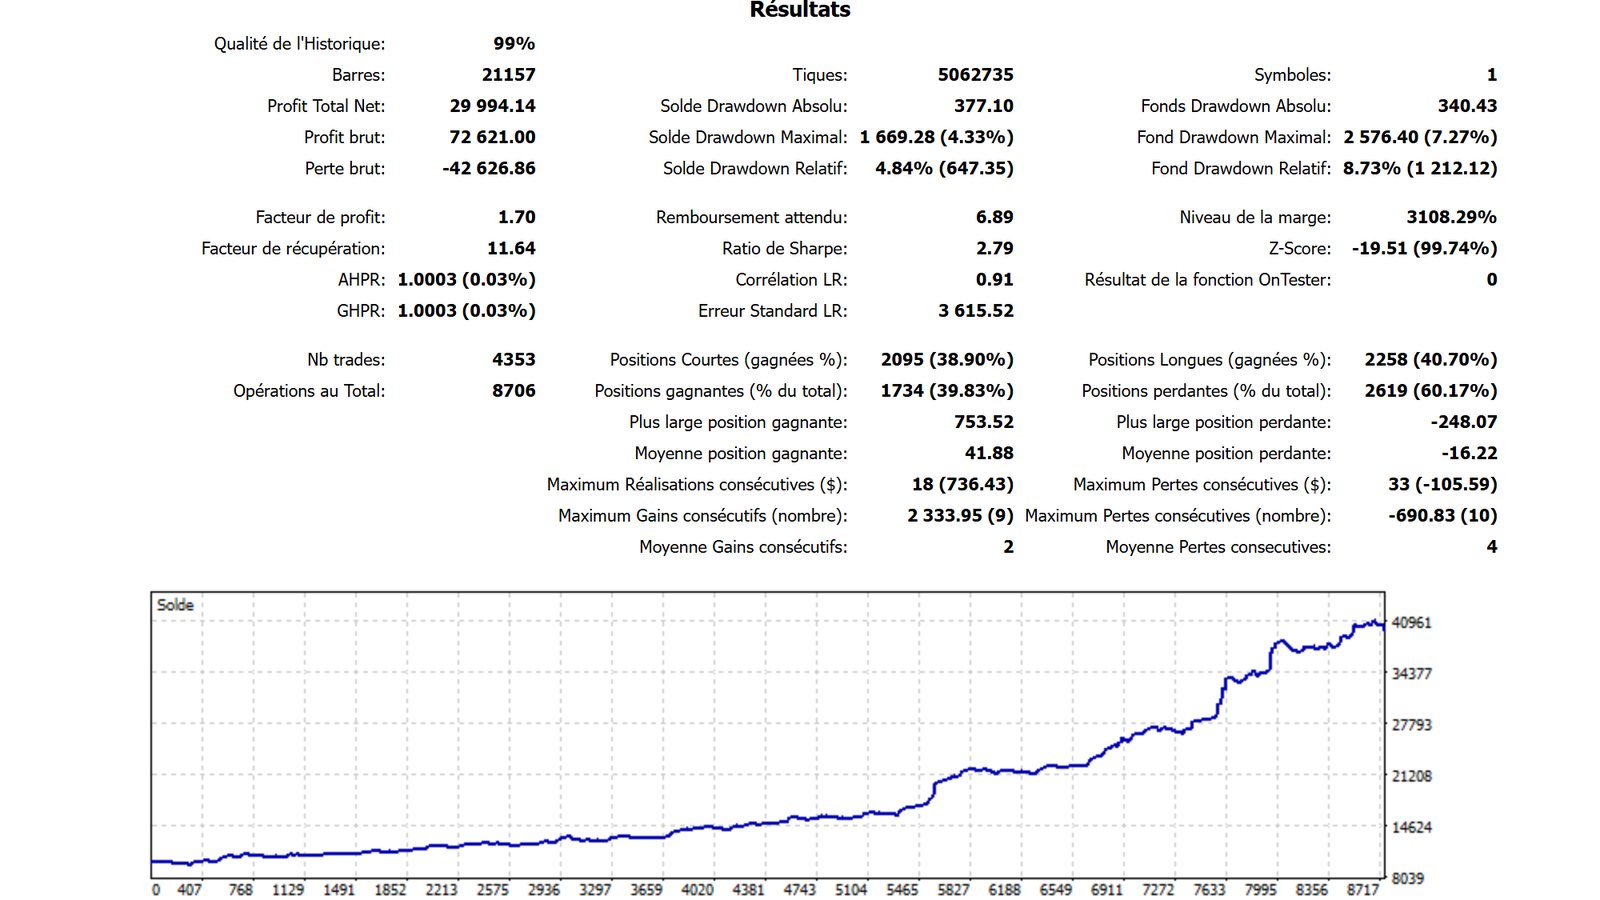
| Preset (10,000 $, his window) | Net profit, gallery | Net profit, measured | Profit factor gallery / measured | Max equity drawdown gallery / measured |
|---|---|---|---|---|
| Conservative | +29,943.79 $ | +29,994.14 $ | 1.70 / 1.70 | 7.75% / 7.27% |
| Moderate | +77,562.50 $ | +68,945.65 $ (-11%) | 1.80 / 1.76 | 16.70% / 17.21% |
| Aggressive | +298,032.39 $ | +268,938.59 $ (-10%) | 1.67 / 1.64 | 27.52% / 29.60% |
Fifty dollars apart out of almost thirty thousand, at another broker with a different price history: that is the strongest result of this test. A backtest that reproduces elsewhere guarantees nothing about the future, but it shows the published figures do not depend on one particular price feed or a hidden setting. On Moderate and Aggressive I get about 10% less profit and a slightly deeper drawdown, nothing that changes the meaning of the result.
Drawdowns against his ranges
| Preset | Stated range | Relative drawdown at 10,000 $ | Recommended minimum | Drawdown at that capital |
|---|---|---|---|---|
| Conservative | 10 to 15% | 8.73% | 20,000 $ | 10.23%, inside the range |
| Moderate | 20 to 25% | 17.21% | 15,000 $ | 17.78%, below the range |
| Aggressive | 35 to 40% | 29.60% | 10,000 $ | 29.60%, below the range |
Over his three and a half year window, none of the three presets exceeds its range. The ranges come from a simulation, and the page itself warns that future drawdowns can exceed them: one backtest path staying inside is consistent with the range, not proof it will never be crossed. And, as section 8 shows, these numbers only hold at the intended capital.
The other claims, checked
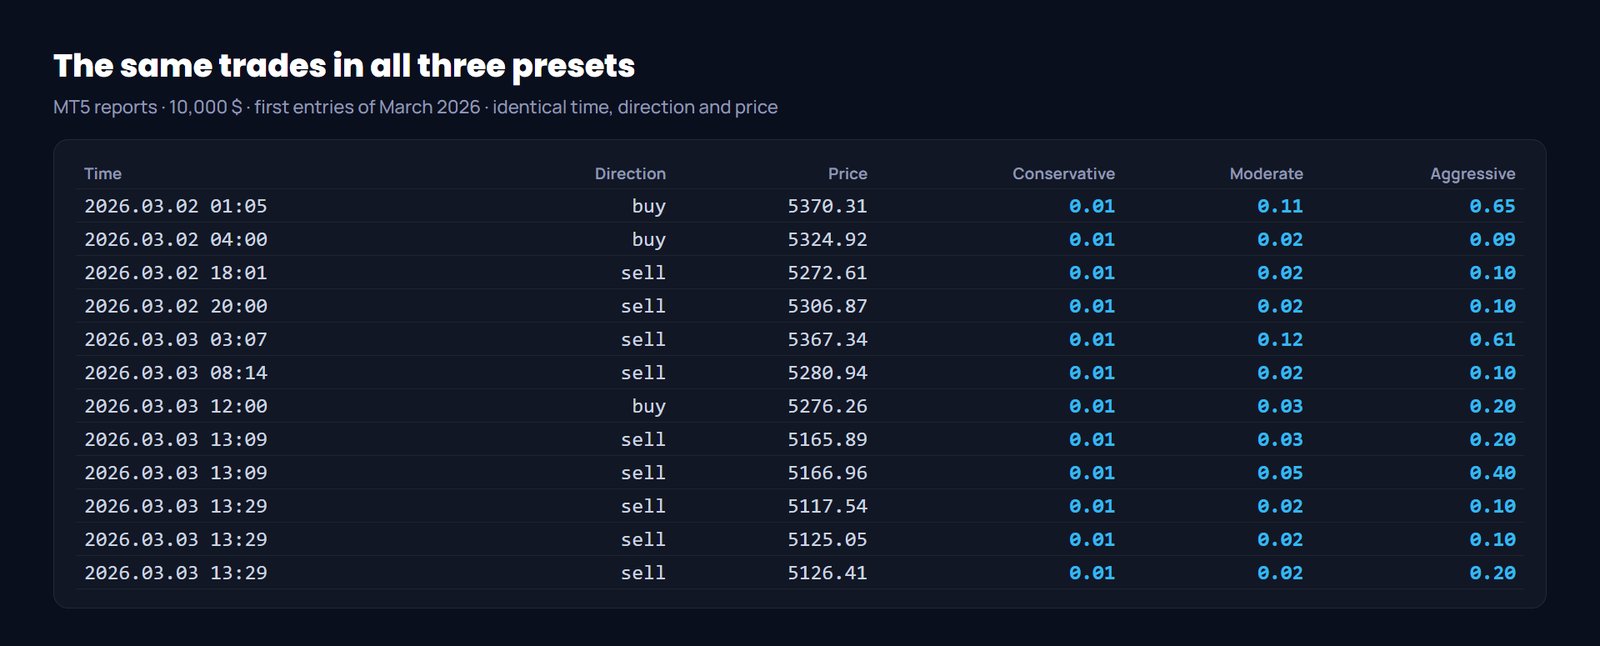
I compared the trade lists of the three presets entry by entry: same time, same direction, same price, on 4,353 trades out of 4,353. Only the size changes.
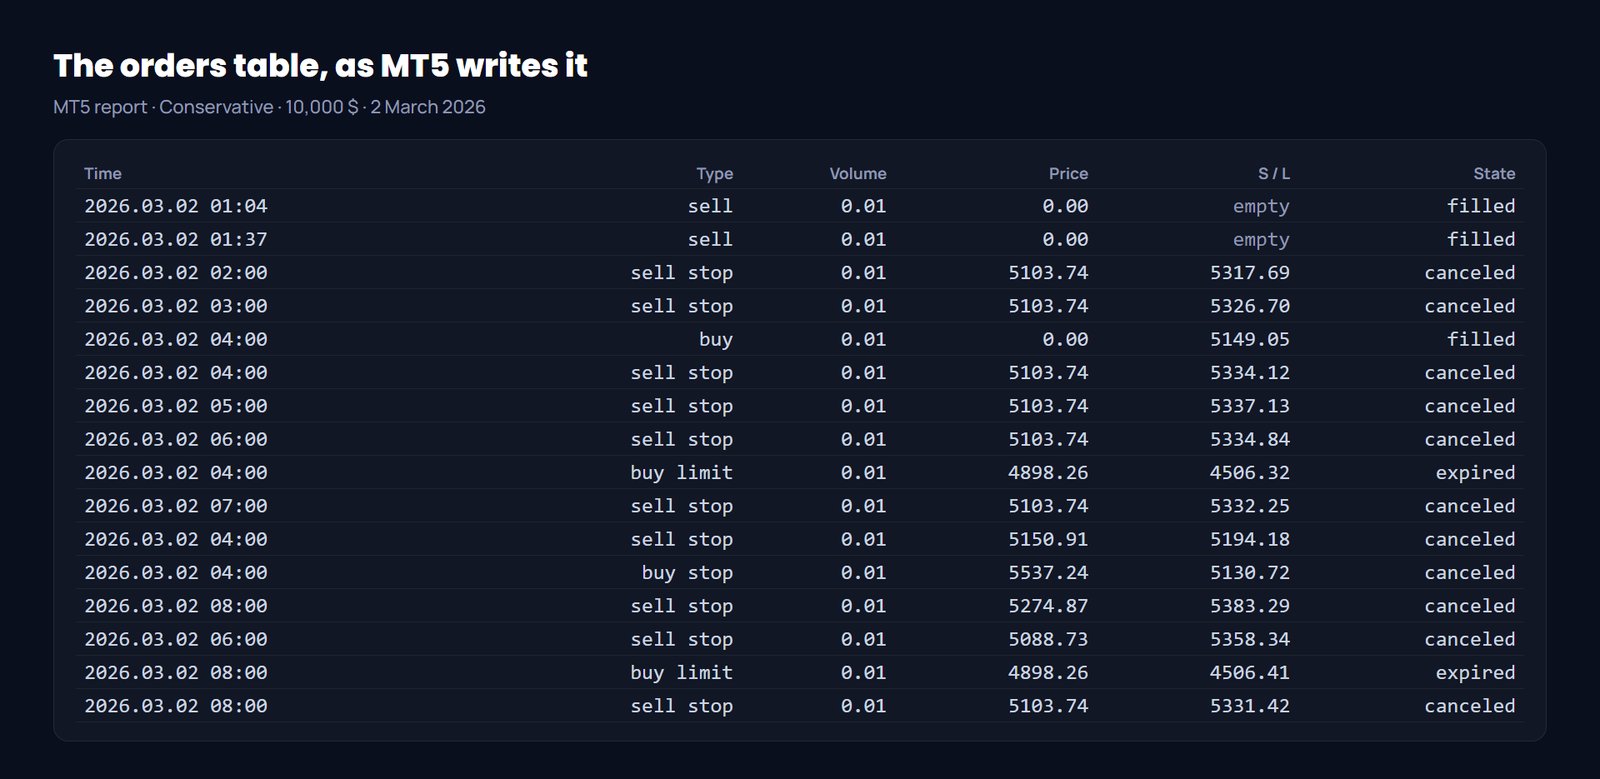
In the orders table of the MT5 report, every entry carries a stop at the broker from the moment it opens: 4,353 entries out of 4,353. The only orders without a stop are the closing ones. You can also see how it works: it places stop and limit orders at price levels, hour after hour, and removes them if price does not come. In June 2026 alone, 1,452 buy stop orders were placed and cancelled that way.
| Claim on the page | Measurement (his window, 10,000 $) |
|---|---|
| Same trades for the three presets | Yes: 4,353 identical entries |
| A fixed stop on every trade | Yes: 4,353 entries out of 4,353 with a broker-side stop |
| About 100 trades a month | 101.6 a month on average |
| Never more than 26 simultaneous positions | 20 at most, on 21 July 2025 |
| Held from hours to several days | 27 h 39 on average, from 19 seconds to 755 hours (31.5 days) |
| No martingale | Conservative at 5,000 $: all 4,353 entries at 0.01 lot, no size increase after a loss |
Costs: commission and swap
His page raises the question itself: gold is expensive to hold, and the swap is heavily one-sided. Positions last just over a day on average, so the swap is paid or received most nights.
| Conservative, 10,000 $, his window | Amount |
|---|---|
| Profit before costs | +30,821.19 $ |
| Commission | -269.66 $, 0.9% of profit before costs |
| Net swap | -557.39 $, 1.8% of profit before costs |
| of which paid by buys | -2,176.41 $ |
| of which received by sells | +1,619.02 $ |
| Net profit | +29,994.14 $ |
The swap is indeed one-sided: buys pay, sells receive. His page says holding a buy costs several times what holding a sell pays; at IC Markets, over this window, buys pay about a third more than sells earn. Over his window, costs do not eat the edge. One limit: the MT5 tester applies today's swap to the whole history, and every broker has its own swap and commission table. At yours, this weight may differ.
The test on video, report by report: watch it on YouTube.
Real ticks against 1 minute OHLC
From April to September 2026, when real ticks exist at IC Markets, I ran the three presets twice on 10,000 dollars: on real ticks, then on 1 minute OHLC.
| Preset (April to September 2026) | Real ticks: profit / PF / drawdown | 1 minute OHLC: profit / PF / drawdown | Profit gap |
|---|---|---|---|
| Conservative | +2,165.88 $ / 1.18 / 23.23% | +2,643.36 $ / 1.23 / 21.76% | -18% |
| Moderate | +2,134.69 $ / 1.17 / 24.20% | +2,510.50 $ / 1.20 / 22.74% | -15% |
| Aggressive | +2,042.42 $ / 1.14 / 28.98% | +2,422.88 $ / 1.17 / 27.58% | -16% |
Same month by month profile, same sign every month. But real ticks give 15 to 18% less profit and a drawdown about one and a half points deeper. One minute mode flatters a little; it reverses nothing.
Also note what the window flatters in his favour: over his 2023 to 2026 window, my Conservative run makes about 47% a year against the 23% he states, because 2025 alone brought +77.7%. His page does not use that number. It shows the lower one and warns that a quiet year for gold can end flat. That is the right reading. To spot the year that carries a whole backtest, see how to read a backtest report in MT5.
Capital, the key point for a buyer
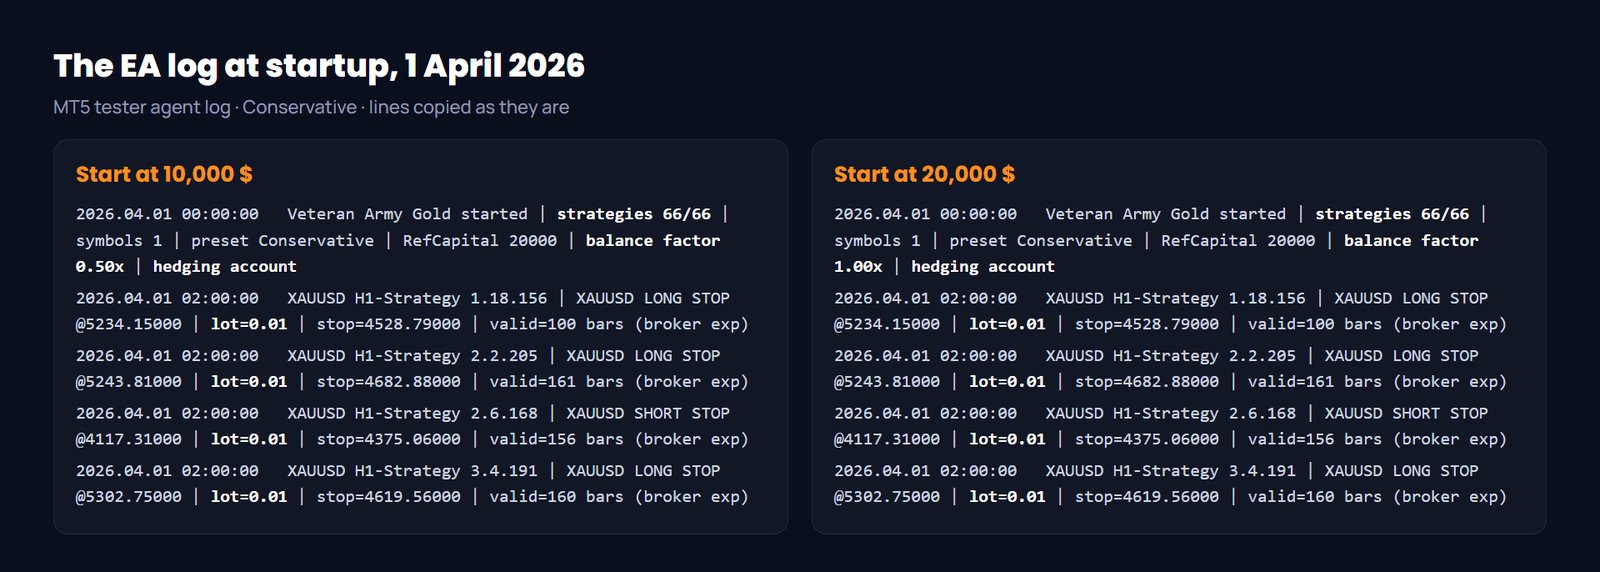
The robot's lots are sized for 20,000 dollars and scaled down on a smaller account. At startup the log says it plainly: balance factor 0.50x on 10,000 dollars, 1.00x on 20,000. But a lot never goes below the broker's minimum of 0.01. On a small account, the Conservative lot falls under that floor and is rounded up to 0.01.
From April to September 2026, on real ticks, I ran Conservative on 20,000 dollars, his recommended capital, then on 10,000. Result: the same 561 trades, the same 0.01 lots everywhere, so exactly the same gain in dollars, +2,165.88. But the equity drawdown goes from 11.96% to 23.23%. Double, on the most cautious preset.
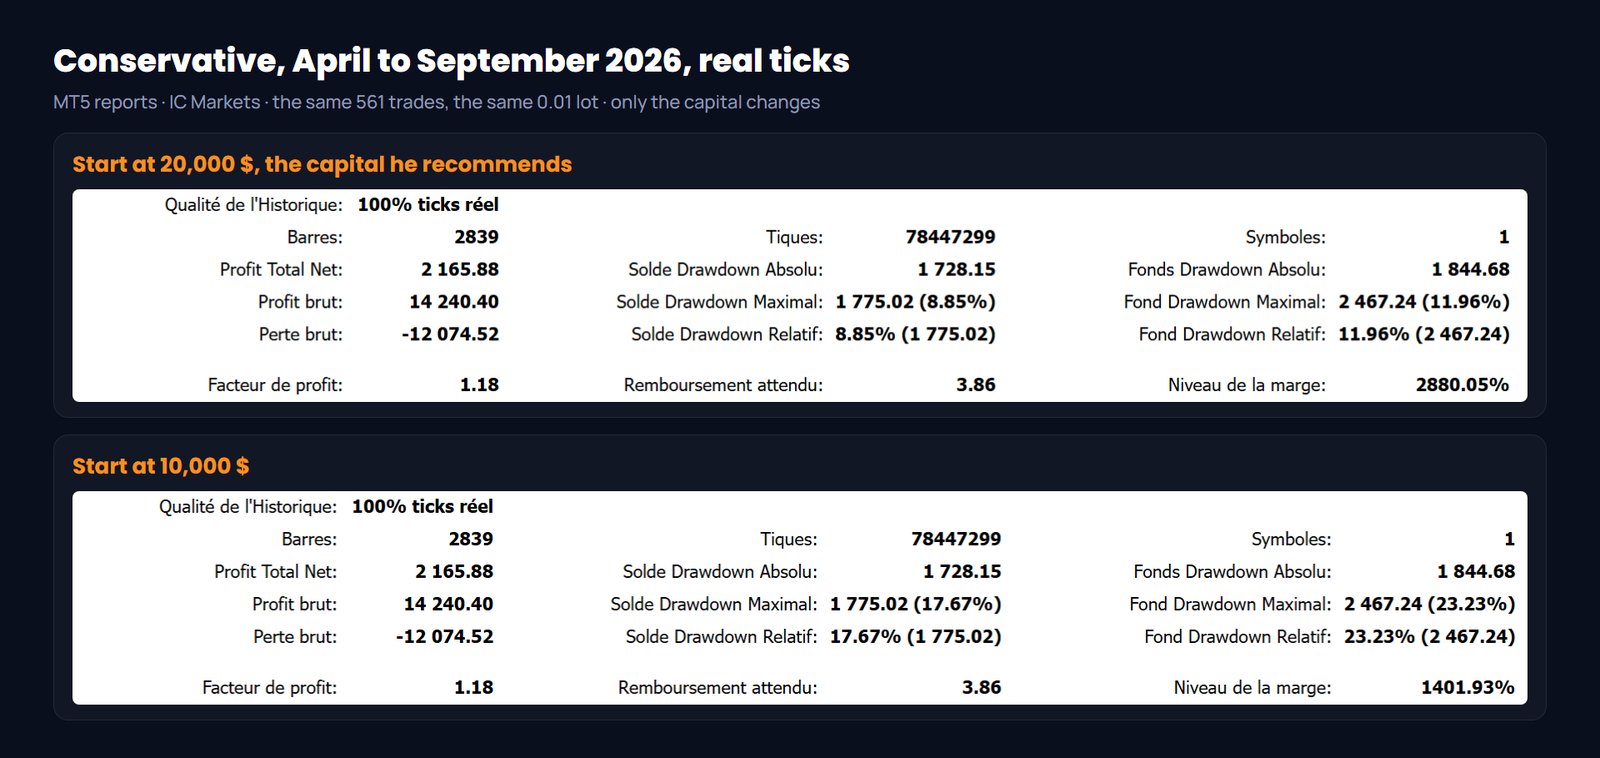
That is exactly what his own minimum capital table anticipates: 20,000 dollars for Conservative, 15,000 for Moderate, 10,000 for Aggressive. Below those amounts, the preset you pick is not the one you get. The same effect, weaker, hits Moderate: 19.59% drawdown at 15,000 dollars against 24.20% at 10,000 over the same months.
On his long window at 5,000 dollars, the starting balance of his own live account, Conservative only has 0.01 lot trades from first to last, and its relative drawdown rises to 13.65% against 8.73% at 10,000. One caution of method: the effect shows on a fresh start, like a buyer's. Over the long window the balance grows and lots grow with it, which blurs the comparison.
Since release: August and September 2026
| Setup (1 August to 23 September 2026, real ticks) | August | September | Drawdown |
|---|---|---|---|
| Conservative, 20,000 $ (recommended capital) | +9.88% | -6.64% | 7.68% equity |
| Conservative, 10,000 $ | +19.76% | -12.18% | 13.98% equity |
| His live account setup, replayed (Aggressive, doubled lots, 5,000 $, 1:500) | +46.48% | -32.29% | 33.18% balance |
| His live account at Pepperstone, public signal read on 24 September 2026 (illustration) | +80.54% | -34.51% | 36.28% balance |
At the recommended capital, Conservative gains almost 10% in August, gives back 6.64% in September, and its drawdown reaches 7.68%, below its range. On 10,000 dollars, the same trades make +19.76% then -12.18%. Same lesson: capital sets the risk.
He also publishes a live account at Pepperstone since 1 August, which he himself presents as a stress test: the Aggressive preset with doubled lots, on 5,000 dollars. I quote it as an illustration, not as a test result. Replaying exactly that setup over the same weeks gives +46.48% in August and -32.29% in September: the same shape, a very good month then a deep pullback, with a balance drawdown of 33.18% in the backtest against 36.28% on his account. The August gap is at least partly down to the broker's different price feed.
Over these eight weeks that setup ends at -40.71 dollars: +23.30 before costs, then 16.08 of commission and 47.93 of swap. On a flat period, costs decide the sign.
Verdict
His gallery figures reproduce at another broker, within 50 dollars on Conservative. At the intended capital, drawdowns never exceed his ranges. Costs do not eat the edge over his window. And his page does not show the most flattering reading of his own window, it shows the most cautious one. The testable claims of the page all hold, with one nuance on the gallery's modelling mode, whose measured effect is limited.
This test does not say what the robot will do tomorrow: a backtest, even reproduced, describes the past, and eight weeks after release is a short sample.
| What to check before running it | Why |
|---|---|
| Starting capital | Below 20,000 $ on Conservative, 15,000 $ on Moderate or 10,000 $ on Aggressive, the 0.01 lot floor pushes the real risk above the stated range (up to double, measured on Conservative) |
| Account type | Hedging is required: the robot holds up to 20 positions at once on gold, which a netting account would merge into one |
| Your broker's swap and commission | The tester applies today's swap to the whole history, and every broker has its own table |
| The modelling mode of your own backtests | 1 minute OHLC gave 15 to 18% more profit than real ticks from April to September 2026 |
No recommendation to buy or use this robot is made here. This page reports what measurements gave over past periods.
Frequently asked questions
Does Veteran Army Gold match its gallery?
How much capital does Veteran Army Gold need?
Does Veteran Army Gold use a martingale?
Are his gallery backtests on real ticks?
How much does the swap weigh?
How has it done since release?
MT5 tools built by the same standard
Structure, order blocks and risk management indicators for MetaTrader 5, published on the official MQL5 Market. Same standard as the tests published here: real captures, measured numbers, no promises. If you read French, the complete backtest protocol applied in this test is available here.
This content is educational and is in no way investment advice or a purchase recommendation. Past performance, measured in backtest or on a live account quoted as an illustration, does not predict future results. Leveraged trading carries a high risk of rapid capital loss, up to the full amount invested.