
Gold Zilla AI review: independent MT5 test, backtests and live account
Gold Zilla AI review: his backtests reproduce,
the drawdown goes past the 10% advertised
Five strategies on gold, published backtests, a public live account. I replayed his settings at the broker he recommends, on the version on sale. His backtests reproduce within ten trades, and his live account follows the backtest. But the drawdown advertised at 10% does not hold: his own report shows a 13.27% maximum drawdown, and 23.81% relative.
No optimisation
Risk warning: this content is strictly educational and is not investment advice. Leveraged trading carries a high risk of capital loss. No trading robot is recommended here.
The test on video, with an English audio track: watch it on YouTube.
1,000 dollars that turn into 40,000 on the medium risk setting, and a drawdown held to 10%: that is what the product page images of Gold Zilla AI show, a gold robot sold for 399 dollars on the MQL5 Market. I replayed his settings at IC Markets, the broker his product page names as preferred.
His published report and mine are ten trades apart over six years, 3,038 against 3,048, with a profit factor of 1.60 against 1.57, and his live account follows the backtest trade by trade. But the drawdown advertised at 10% does not hold: his own report shows a 13.27% maximum drawdown, and 23.81% relative.
This page details the backtests, the MT5 reports behind every number, his promises against the measurements, and his live account against the backtest, month by month and then trade by trade.
Gold Zilla AI 1.8, the version on sale, in the free Market demo. IC Markets, demo account, 1:100 leverage, XAUUSD M5, 1,000 dollars, Every tick, no optimisation. Long window from 1 January 2020 to 28 February 2026, real ticks control from April to September 2026. Full conditions and their limits are detailed below.
What the Gold Zilla AI Market page claims
Gold Zilla AI is an MT5 expert advisor sold for 399 dollars on the MQL5 Market by Christophe Trouillas. The tested version is 1.8, updated on 21 July 2026: the one a buyer gets today. It runs five strategies on gold, XAUUSD, on the five minute chart, and picks between them according to the market regime it detects.
Its inputs name the five strategies: a mean reversion grid, intraday trend following, an opening range breakout, intraday scalping and an intraday "scalpout". The first one, the grid, is at the heart of the result: see section 3.
| What his page and its images show | Checked in |
|---|---|
| Medium risk: 1,000 $ turn into 40,000 $, "x 40", "Final 3281%" | Sections 5 and 7 |
| "Average Annual Return of 50%" on medium risk | Section 7 |
| "Contained DD of Max 10%" on medium risk | Section 7 |
| Low risk: 1,000 $ turn into 6,000 $; high risk: 1,000,000 $ | Section 4 |
| "Tested period 2017-2025, Every Tick" | Section 6 |
| "Out of Sample since 2023" | Section 7 |
| Risk management by artificial intelligence, "Powered by Grok" | Cannot be tested, see below |
The artificial intelligence layer cannot be tested: in the strategy tester, MetaTrader blocks internet requests, so the AI never runs there. It was also switched off in the tested settings. This test measures the algorithm, exactly like his published backtests, and says nothing, good or bad, about what the AI adds on a live account.
He also publishes a live account, tracked by MQL5 at IC Markets: +148.19% when read on 29 September 2026, on a starting deposit of 987.48 dollars. Sections 11 to 13 compare it with the backtest.
Test conditions
| Item | Test value |
|---|---|
| Robot and version | Gold Zilla AI 1.8, the version on sale (updated 21 July 2026), free Market demo downloaded on 29 September 2026 (strategy tester only) |
| Settings | Medium risk, compounding on, five strategies, AI and filters off. Grid fixed lot at its default value, 0.02, except for one measurement in section 3. No optimisation |
| Broker and server | IC Markets, ICMarketsSC-Demo server, demo account. His live account runs at the same broker, on a live server |
| Leverage and capital | 1:100, 1,000 dollars, like his published report |
| Symbol and timeframe | XAUUSD, M5 |
| Modelling | Every tick, 99% history quality, ideal execution |
| Periods | 1 January 2020 to 28 February 2026, April to September 2026 (real ticks), January to September 2026 (against his live account) |
One detail of method matters. At IC Markets, real gold ticks only go back to April 2026. Over six years, a "real ticks" backtest would be mostly generated by the terminal. The long window therefore runs on Every tick, and real ticks serve as a control from April to September 2026. Section 10 measures the gap.
One setting to know before you open the robot: in version 1.8 the default risk level is medium and the fixed lot is 0.02 (adjustable from 0.02 to 0.2), but only strategy 2 is enabled. To replay his published backtests, which run all five, they have to be switched on by hand.
If these modelling modes are new to you, our guide on how to backtest an EA in MetaTrader 5 explains them one by one.
The grid's fixed lot, meant to be 0.02
One setting deserves a closer look: the grid's fixed lot. Its default, 0.02, is meant for 1,000 dollars. To see what this setting changes, I set it to 0.50, 25 times more, with medium risk, compounding and all five strategies.
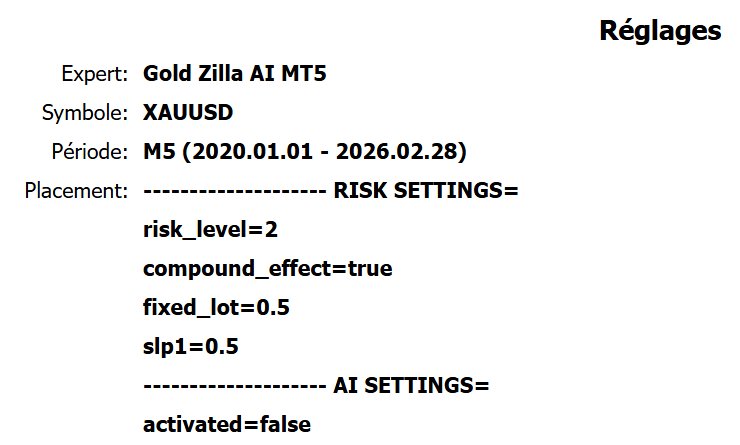
With a 0.50 fixed lot, from 1 January 2020 to 28 February 2026, the 1,000 dollars end at 2,234.55 dollars. Profit factor 1.08. Equity drawdown: 81.36%, maximum and relative alike.
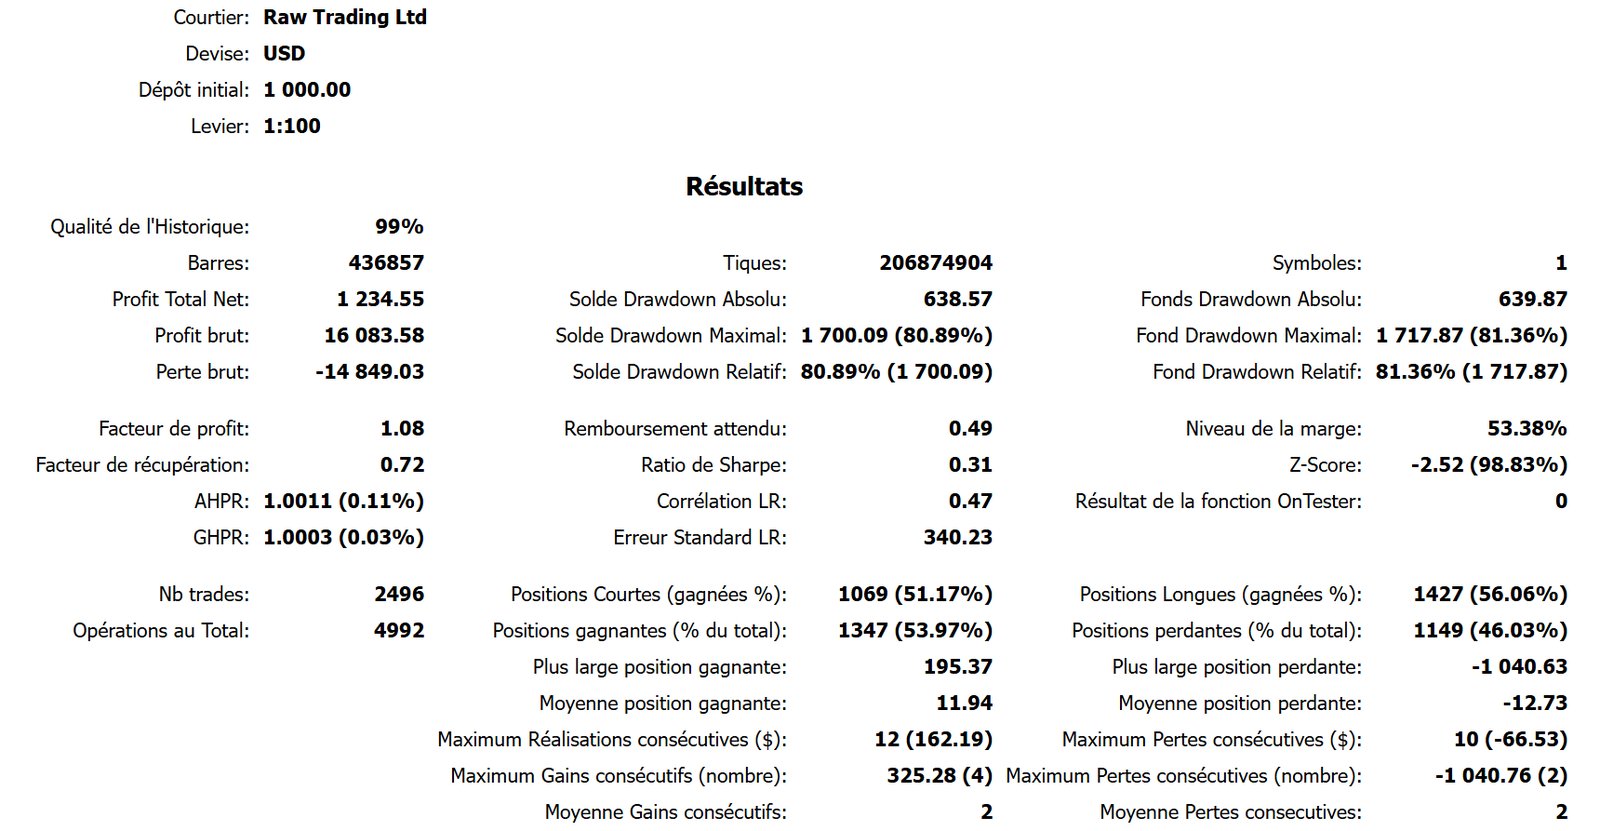
Why such a gap? This fixed lot only applies to one strategy: the first, the mean reversion grid. At 0.50 it opens half a lot on a 1,000 dollar account, 25 times the intended size. Its worst position loses 1,040.63 dollars, more than the whole starting deposit. In July 2021 the account drops 56.4% in that month alone, and 2020, 2021, 2022 and 2024 all end at a loss.
Proof that this input only touches the grid: without the grid, I ran the same robot with a 0.50 then a 0.02 fixed lot. Result: 19,873.35 dollars against 19,871.66, the same 2,418 trades, the same 17.94% relative drawdown.
| Five strategies, 1,000 $, 2020 to February 2026 | Fixed lot 0.50 | Fixed lot 0.02 (1.8 default) |
|---|---|---|
| Final balance | 2,234.55 $ | 27,332.05 $ |
| Deposit multiple | 2.23 | 27.33 |
| Compound annual return | 13.95% | 71.13% |
| Profit factor | 1.08 | 1.56 |
| Maximum equity drawdown | 81.36% | 12.30% (3,644.02 $) |
| Relative equity drawdown | 81.36% | 25.14% |
| Largest lot opened | 0.50 | 0.17 |
With the default value, 0.02, meant for 1,000 dollars, everything changes: 27,332.05 dollars at the end of the period, a 1.56 profit factor and 71.13% a year, compounded. And the curve takes the shape of the one published on his page.
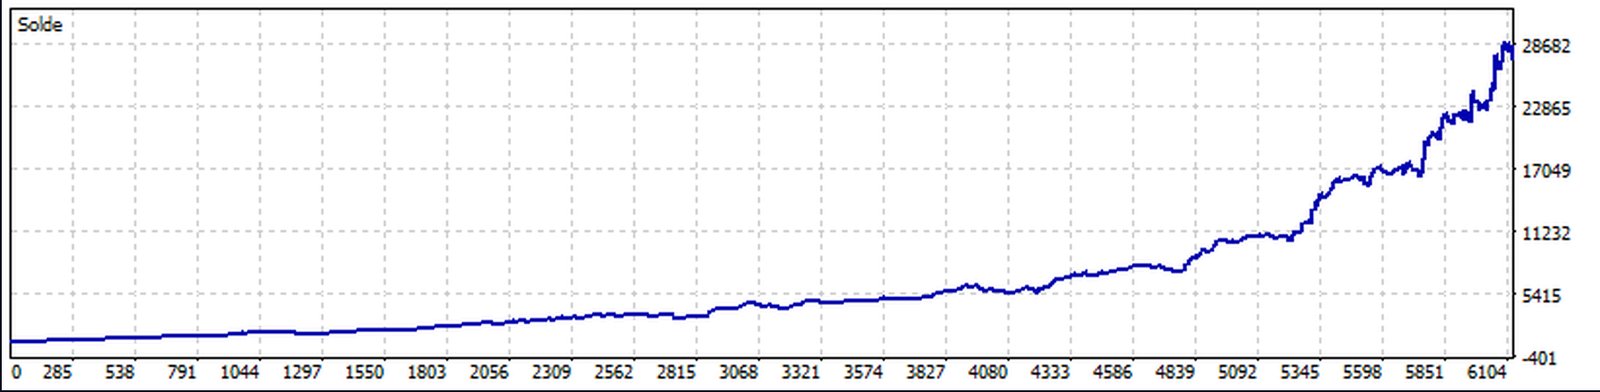
So the seller plans 0.02 for 1,000 dollars, and the measurement shows why. The same lot does not carry the same risk on every account size: risk is measured as a share of capital, not as a lot size.
The three risk levels against his published backtests
| Risk level (five strategies, default lot, 1,000 $) | His published backtests | Measured deposit multiple | Profit factor | Relative drawdown |
|---|---|---|---|---|
| Low | ×6 | ×7.38 | 1.61 | 23.27% |
| Medium | ×40 | ×27.33 | 1.56 | 25.14% |
| High | ×1,000 | ×654.49 | 1.54 | 34.75% |
The three levels follow the order of his backtests: about seven times the deposit on low risk, twenty-seven times on medium, six hundred and fifty times on high, where his page announces six, forty and one thousand. His High Risk image states "Contained DD of Max 23%"; the high risk level measured here reaches 34.75% relative.
His published report, reproduced at IC Markets
His page does not only show a curve: it also publishes the full MT5 report of his medium risk backtest.
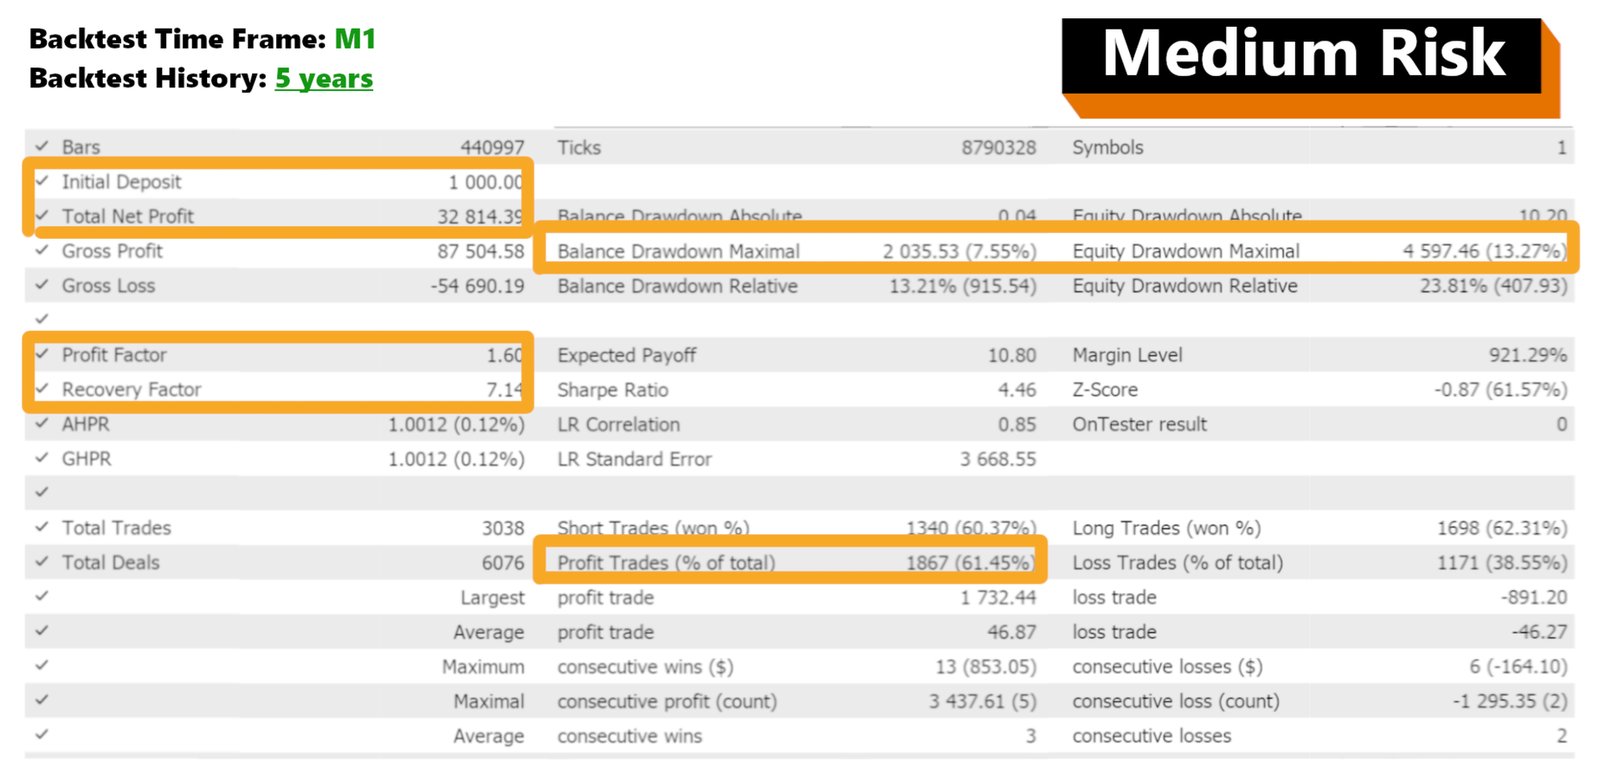
| Medium risk, five strategies, 1,000 $ | His published report | My test, 1 minute OHLC | My test, Every tick |
|---|---|---|---|
| M5 bars | 440,997 | 436,857 | 436,857 |
| Ticks | 8,790,328 | 8,707,624 | 206,874,904 |
| Net profit | 32,814.39 $ | 27,089.12 $ | 26,332.05 $ |
| Profit factor | 1.60 | 1.57 | 1.56 |
| Maximum equity drawdown | 4,597.46 $ (13.27%) | 3,767.68 $ (12.40%) | 3,644.02 $ (12.30%) |
| Relative equity drawdown | 23.81% (407.93 $) | 24.83% (410.00 $) | 25.14% (411.45 $) |
| Trades | 3,038 | 3,048 | 3,048 |
| Winning trades | 61.45% | 61.38% | not read |
Ten trades apart over six years, a 1.60 against 1.57 profit factor, 61.45% against 61.38% winning trades. His backtests reproduce. Two drawdown lines, two readings: the maximum drawdown is the largest dip in dollars, 4,597.46 dollars in his report, 13.27% of the account at that time; the relative drawdown is the worst dip in percent, reached while the account is still small, 23.81% for only 407.93 dollars. On a compounding account both are true, and they do not say the same thing; this test quotes both. Part of the profit gap comes from the period: his runs 4,140 bars longer, into March 2026 according to his monthly table. And his worst drawdown month and mine fall in exactly the same month, September 2022: -10.5% in his monthly table, -8.57% on the balance in my test, with a 12.54% trough.
The mode of his report: 1 minute OHLC
Now look at the tick count. His report counts 8,790,328 ticks for 440,997 M5 bars, where real Every tick counts 206,874,904 over the same period at IC Markets. 20 ticks per bar is the signature of 1 minute OHLC mode: five one minute candles per five minute bar, four prices per candle. My own 1 minute OHLC run shows 8,707,624 ticks for 436,857 bars, the same signature.
His page states a tested period of "2017-2025, Every Tick", and his curve slide says "Backtest Time Frame M1". The tick count of the report published on his page matches 1 minute OHLC, not Every tick. Here it changes almost nothing: 27,089.12 dollars of profit in 1 minute OHLC against 26,332.05 on Every tick, +2.9%. The result holds in both modes. Reading the tick count is one of the reflexes in our guide on how to read a backtest report in MT5.
50% a year and a 10% drawdown: what holds, what does not
His medium risk slide promises two things: "Average Annual Return of 50%" and "Contained DD of Max 10%".
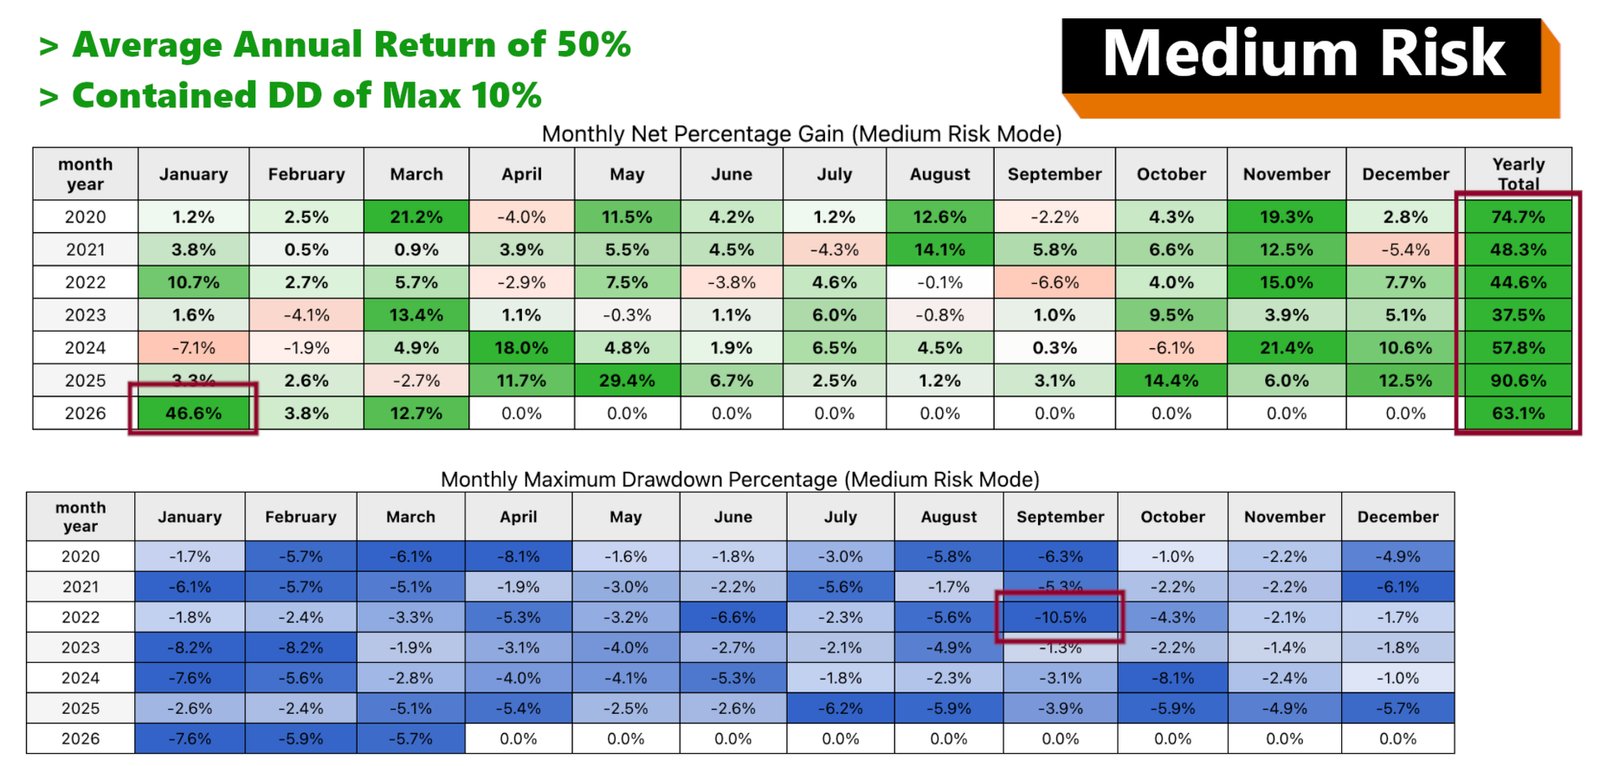
The return holds, by a wide margin. Measured: 71.13% a year, compounded, over six years.
| Year | My test (Every tick, lot 0.02) | His published backtests (Medium) |
|---|---|---|
| 2020 | +79.27% | +74.7% |
| 2021 | +48.26% | +48.3% |
| 2022 | +60.47% | +44.6% |
| 2023 | +45.36% | +37.5% |
| 2024 | +68.08% | +57.8% |
| 2025 | +133.93% | +90.6% |
| 2026 | +12.13% (January and February) | +63.1% (January to March) |
His page mentions an out of sample period since 2023: over those years the measured return holds, +45.36%, +68.08%, then +133.93%. Over the whole window, sixteen losing months out of seventy-four.
The drawdown goes past 10%. His own report shows a 13.27% maximum equity drawdown, and 23.81% relative. The slide's 10% is the worst drawdown of a single month, read in his monthly table, not the worst trough of the account. In my test: 12.30% maximum and 25.14% relative. On his live account, MQL5 shows a maximum drawdown of 21.8%. Same thing for the "x 40" on his curve: his report stops at 32,814.39 dollars of net profit, a 33,814 dollar balance, 33.8 times the deposit. The right number is on the same slide, above the curve: "Final 3281%". His reports say the same thing as mine; it is the sentences added on the slides that need a second look.
The test on video, report by report: watch it on YouTube.
Without the grid: what strategy 1 adds, and what it costs
On his live account, since 21 August 2026, no grid trade appears any more. So I also ran the robot without it, strategies 2 to 5, over the same six years.
| Medium risk, 1,000 $, 2020 to February 2026 | Five strategies | Without the grid |
|---|---|---|
| Final balance | 27,332.05 $ | 19,871.66 $ |
| Compound annual return | 71.13% | 62.50% |
| Profit factor | 1.56 | 1.55 |
| Maximum equity drawdown | 12.30% (3,644.02 $) | 12.20% (2,639.95 $) |
| Relative equity drawdown | 25.14% | 17.94% |
Without the grid: 19,871.66 dollars, 62.50% a year, a 12.20% maximum and 17.94% relative drawdown. So the grid adds return, and about seven points of relative drawdown; in maximum terms both stay around 12%. It is a risk choice, not a hidden flaw. Without it, every year stays positive, from +38.74% in 2023 to +127.79% in 2025, and the worst month is still September 2022 (-9.21% on the balance, 12.62% trough). Without compounding, on a fixed lot, the robot without the grid still makes 10,096.32 dollars, 45.57% a year, with a 25.36% relative drawdown: compounding does the rest.
For prop firm accounts he also offers filters. With night and weekend trading off, on all five strategies, the drawdown drops to 11.52% maximum (2,171.19 dollars) and 16.22% relative, at the cost of a lower annual return.
Each strategy alone, then all five together
| 1,000 $, 2020 to February 2026 | Final balance | A year (compounded) | Profit factor | Relative drawdown |
|---|---|---|---|---|
| 1. Mean reversion grid | 2,368.26 $ | 15.05% | 3.54 | 24.86% |
| 2. Intraday trend following | 2,053.61 $ | 12.40% | 1.49 | 9.37% |
| 3. Opening range breakout | 2,107.92 $ | 12.92% | 1.50 | 15.39% |
| 4. Intraday scalping | 2,112.72 $ | 12.92% | 1.59 | 7.83% |
| 5. Intraday scalpout | 2,679.27 $ | 17.37% | 1.53 | 10.60% |
| All five, compounded | 27,332.05 $ | 71.13% | 1.56 | 25.14% |
None of them does more than triple the deposit in six years: alone, each one ends between 2.05 and 2.68 times the deposit. It is the stack of all five, compounded, that makes 27.33 times. The leading strategy changes from one year to the next, or almost, and over full years none of the five ended in the red.
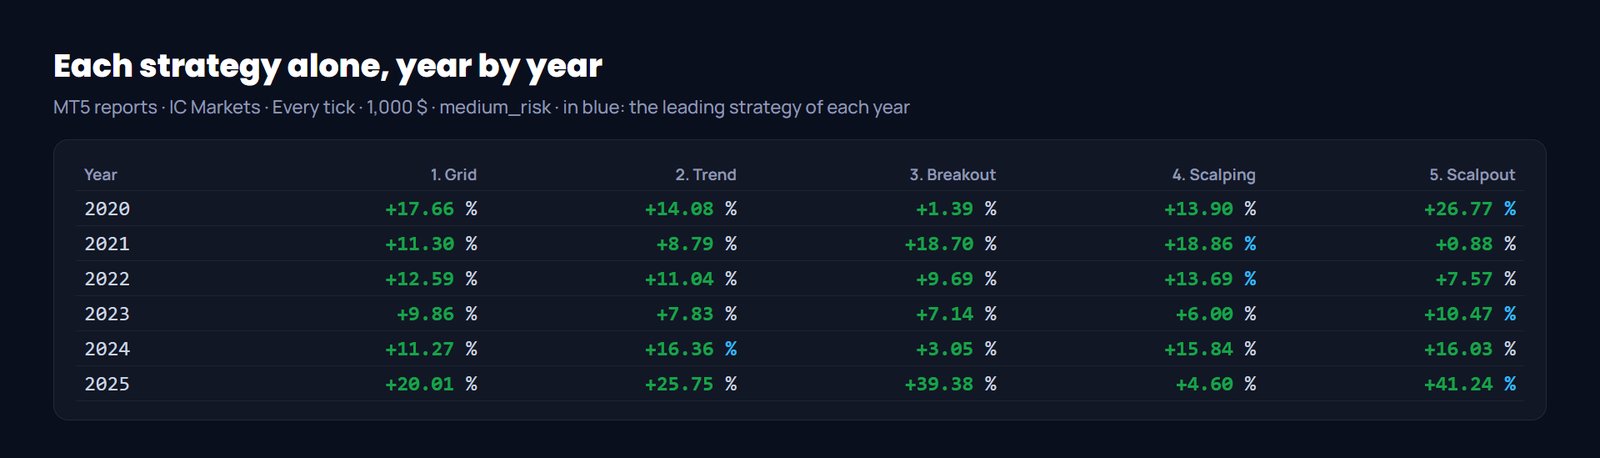
The grid alone has the best profit factor, 3.54, and the worst relative drawdown, 24.86%. It often wins a little and rarely loses a lot: the profile of a grid, and the reason its lot size matters so much.
Real ticks against Every tick, April to September 2026
| 1 April to 27 September 2026, 1,000 $ | Every tick: balance / PF / relative drawdown | Real ticks: balance / PF / relative drawdown | Profit gap |
|---|---|---|---|
| Five strategies | 2,089.84 $ / 1.50 / 20.54% | 2,006.97 $ / 1.46 / 20.10% | -7.6% |
| Without the grid | 1,762.35 $ / 1.36 / 19.56% | 1,681.26 $ / 1.31 / 19.65% | -10.6% |
Exactly the same trades in both modes, 273 with the grid and 225 without, and 7.6 to 10.6% less profit on real ticks. The usual gap, nothing abnormal.
His live account against the backtest, month by month
His Market page overlays his live account and his backtest from January to March 2026, under the title "Ethical backtesting": both curves track each other. I ran the comparison over the whole year, with a backtest that starts like him from 1,000 dollars on 1 January 2026 (his starting deposit: 987.48 dollars), at the same broker, on Every tick.
| 2026 | His live account (MQL5) | Backtest, five strategies | Backtest, without the grid |
|---|---|---|---|
| January | +47.48% | +38.18% | +25.44% |
| February | +3.81% | +8.12% | +2.10% |
| March | +37.37% | +56.91% | +61.72% |
| April | +8.16% | +11.64% | +9.74% |
| May | +3.16% | +2.12% | +0.52% |
| June | +14.15% | +11.56% | +12.57% |
| July | -3.83% | +0.05% | +1.43% |
| August | -5.79% | +9.53% | +9.03% |
| September | +2.27% | +1.43% | -2.01% |
| Total | ×2.48 (+148.19%) | ×3.31 (3,313.69 $) | ×2.79 (2,787.12 $) |
Both follow the same road, and from January to March my backtest even ends higher than his account. A single month breaks away: August, -5.79% live against +9.53% in backtest. His live account is quoted as an illustration, not as a test result: read on 29 September 2026, +148.19% from a 987.48 dollar deposit, a 2,450.79 dollar balance, a 21.8% maximum drawdown and a 1.37 profit factor.
Trade by trade: 44 twins out of 48
So I compared trade by trade. Of his last 48 visible trades, from 19 August to 28 September 2026, 44 have their twin in the real ticks backtest, in the same direction, and 43 at the exact same minute.
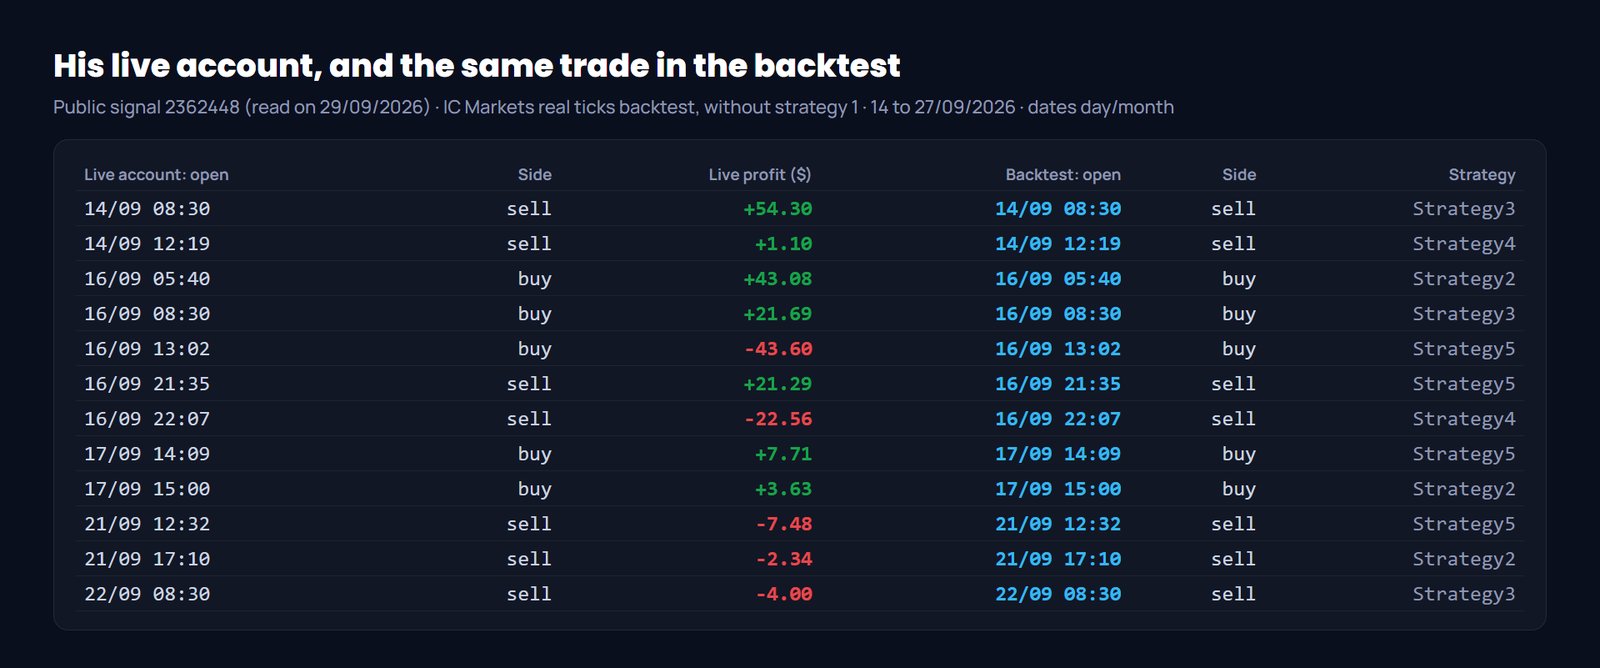
On those 44 trades, his account made -218.26 dollars and the backtest -137.66: about 1.80 dollars per trade, the order of magnitude of what live execution costs against the tester.
Apart from the two trades of 28 September, which the backtest does not cover, the exceptions all fall between 19 and 21 August. His live account sells with the grid, 0.02 lot on 19 August, and loses 353.30 dollars at the close on 21 August. The backtest buys at the same moment, and ends in profit.
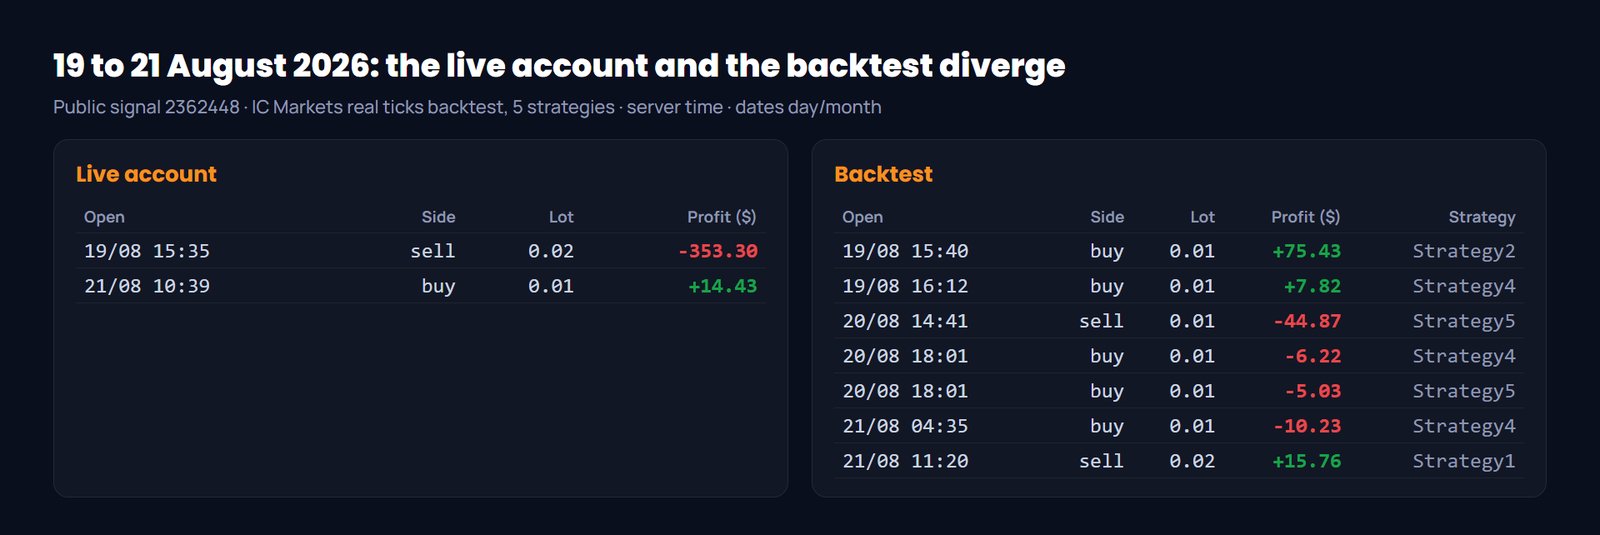
The other way round, leaving the grid aside, six backtest trades never appear on his live account, including that strategy 2 buy at +75.43 dollars; they too all fall between 19 and 21 August. Since 21 August, his account takes no grid trade any more. The live account follows the backtest, except during that grid episode. MQL5 also flags it on his account page: "80% of growth achieved within 7 days". Over 264 days, 2.65% of the time produced 80% of the growth.
Starting in January: the first month dip
One figure to know before you start. The backtest started from 1,000 dollars on 1 January 2026, the one that tracks his live account so closely, ends at 3,313.69 dollars on 27 September with a 1.61 profit factor. But its equity drops 39.92% relative (400.02 dollars) in the very first month: the dip comes while equity has never been above 1,002 dollars, before the balance passes 1,107.30 dollars on 28 January. In maximum terms, the largest dollar dip of the period, 472.82 dollars, weighs only 20.05%: it comes later, on a bigger account. That is exactly the gap between the two drawdown readings.
| Start at 1,000 $ on 1 January 2026, Every tick | Five strategies | Without the grid |
|---|---|---|
| Balance on 27 September 2026 | 3,313.69 $ | 2,787.12 $ |
| Relative equity drawdown | 39.92% | 24.66% |
Over the six year run, the same episode goes unnoticed: on 1 January 2026 the account already held 24,376 dollars. For an account that is just starting, the early dip weighs in full; on an account that has already grown, it disappears in the curve.
The four checks behind this test, for any robot
You can repeat these four checks on any robot on the Market, with its free demo and your own MetaTrader.
| Check | How | What it showed here |
|---|---|---|
| 1. The report's mode | Divide the ticks by the bars. On M5, around 20 means 1 minute OHLC: four prices per minute | His published report: 8,790,328 ticks for 440,997 bars, 20 per bar. In true Every tick, this test has over four hundred and seventy (206,874,904 ticks for 436,857 bars) |
| 2. The right drawdown | In the report itself, read the relative equity drawdown, with the maximum next to it. Not a table of monthly losses | His report: 13.27% maximum, 23.81% relative, against "Max 10%" on his page |
| 3. The settings | Load the settings shown on his page into the version on sale, run them as is, then reread every input | Here, the grid's fixed lot, meant to be 0.02 for 1,000 dollars (its default): section 3 shows what this setting changes |
| 4. The live account | Compare it with a backtest started from the same deposit, on the same date | January 2026: +38.18% for the backtest started from 1,000 dollars, +13.2% for the six year run, which already held 24,376 dollars. His live account: +47.48% |
One last practical point: his product page recommends a 2,000 dollar deposit and accepts 500. This test starts from 1,000 dollars, like his published backtests.
Verdict
His backtests reproduce within ten trades at the broker he recommends. His live account follows the backtest trade by trade, one grid episode aside. Without the grid, the robot stays profitable over six years of backtest. And the return announced on his page holds by a wide margin.
This test describes the past: six years of backtest, nine months of live account, at a single broker. It does not tell you what the robot will do next.
| What to check before running it | Why |
|---|---|
| The grid's fixed lot | Meant to be 0.02 for 1,000 dollars, its default value: with it, a 12.30% maximum and 25.14% relative drawdown over six years |
| The enabled strategies | By default, version 1.8 only enables strategy 2; his published backtests run all five |
| The drawdown to expect | Over six years, around 12% maximum (11.52% with the night and weekend filters, 12.20% without the grid, 12.30% with all five strategies) and 16 to 25% relative (16.22%, 17.94%, 25.14%), and up to 40% relative on a January start (39.92% measured). His own report: 13.27% maximum, 23.81% relative. His live account: 21.8% as read on MQL5 |
| The modelling of your own backtests | His report runs on 1 minute OHLC; from April to September 2026, real ticks gave 7.6 to 10.6% less profit than Every tick |
| The artificial intelligence layer | Cannot be tested in the strategy tester: neither confirmed nor ruled out by this test |
No recommendation to buy or use this robot is made here. This page reports what measurements gave over past periods.
Frequently asked questions
Does Gold Zilla AI match its published backtests?
Which fixed lot for the Gold Zilla AI grid?
Is the Gold Zilla AI drawdown really 10%?
Are his published backtests on Every tick?
Does his live account follow the backtest?
Was the Gold Zilla AI artificial intelligence tested?
MT5 tools built by the same standard
Structure, order blocks and risk management indicators for MetaTrader 5, published on the official MQL5 Market. Same standard as the tests published here: real captures, measured numbers, no promises. If you read French, the complete backtest protocol applied in this test is available here.
This content is educational and is in no way investment advice or a purchase recommendation. Past performance, measured in backtest or on a live account quoted as an illustration, does not predict future results. Leveraged trading carries a high risk of rapid capital loss, up to the full amount invested.